The LADME schemeLADME describes the pharmacokinetic processes which follow a given dosage regimen.
L = Liberation, the release of the drug from it's dosage form.
A = Absorption, the movement of drug from the site of administration to the blood circulation.
D = Distribution, the process by which drug diffuses or is transferred from intravascular space to extravascular space (body tissues).
M = Metabolism, the chemical conversion or transformation of drugs into compounds which are easier to eliminate.
E = Excretion, the elimination of unchanged drug or metabolite from the body via renal, biliary, or pulmonary processes.
Although LADME processes generally follow the above sequence, these are not discrete events. That is, one process is still occurring while the next one begins. Each event continues to occur well into the next. In fact, all five processes may occur simultaneously. Consider the case of a sustained release drug, the core of the SR tablet may still be liberating drug while previously absorbed drug is being eliminated.

LADME processes can be divided into two classes, drug input and drug output.
Input processes are:
L = Liberation, the release of the drug from it's dosage form.
A = Absorption, the movement of drug from the site of administration to the blood circulation.
The term commonly used to describe the rate and extent of drug input is bioavailability. Drugs administered by intravenous routes exhibit essentially 100% bioavailability.
Output processes, or disposition of drug are:
D = Distribution, the process by which drug diffuses or is transferred from intravascular space to extravascular space (body tissues).
M = Metabolism, the chemical conversion or transformation of drugs into compounds which are easier to eliminate.
E = Excretion, the elimination of unchanged drug or metabolite from the body via renal, biliary, or pulmonary processes.
Because our main focus is on IV administered drugs, the remainder of this review will concentrate on output processes.
---------------------------------------------------------------------------------------------------
Distribution
Distribution is the process by which a drug diffuses or is transferred from intravascular space to extravascular space (body tissues). These spaces are described mathematically as volume(s) of distribution.
In the simplest of terms, a drug's volume of distribution is that volume of bodily fluid into which a drug dose is dissolved. Therefore, if we know the dose that was given, and we can measure the serum level (concentration), then we can calculate a volume:
Volume of distribution = Dose / drug concentration
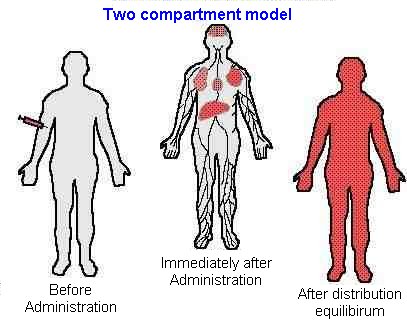
Of course, the human body is not a glass beaker. Drug is distributing in and out of many tissue compartments while it is simultaneously being eliminated. This complex and continually changing environment must be simplified in order to mathematically model the human body. Therefore, the body is usually divided into two spaces, a central and a tissue compartment.
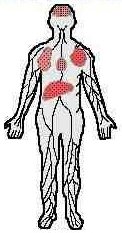
Central volume (Vc)The central volume of distribution (Vc) is a hypothetical volume into which a drug initially distributes upon administration. This compartment can be thought of as the blood in vessels and tissues which are highly perfused by blood.
 Central volume of distribution (Vc) may be calculated as:
Vc = Dose / Peak serum level
Note: by rearranging this equation we can see that dose and Vc are the primary determinates of the peak level:
Peak = Dose / Vc
Peripheral volume (Vt)
The peripheral volume is the sum of all tissue spaces outside the central compartment. Of course, all peripheral tissues are not homogenous, this is a simplification for the purpose of creating a usable mathematical model.
All drugs initially distribute into the smaller Vc before distributing into the peripheral volume. Together, Vc and Vt create the apparent volume of distribution (Vd).

------------------------------------------------------------------------------------------------
Apparent volume of distribution (Vd)Apparent Vd is a term used to describe the volume of fluid that would be required to account for all drug in the body. It does not necessarily refer to any identifiable compartment in the body. It is simply the size of a compartment necessary to account for the amount of drug in the body. Because Vd is hypothetical in nature, it is referred to as an apparent volume.
As you will see, distribution volumes are important for estimating:
Amount of drug in the body
Peak serum levels
Clearance
Summary
To review, the most commonly used volumes of distribution are:
Central volume (Vc)
Tissue (or peripheral) volume (Vt)
Apparent volume of distribution (Vd)
------------------------------------------------------------------------------------------------
EliminationDrugs are cleared primarily by the liver and kidneys. Excretion into the urine is a major route of elimination for metabolites and unchanged drug.
Most drugs are eliminated by a first-order process. With first-order elimination, the amount of drug eliminated is directly proportional to the serum drug concentration (SDC).
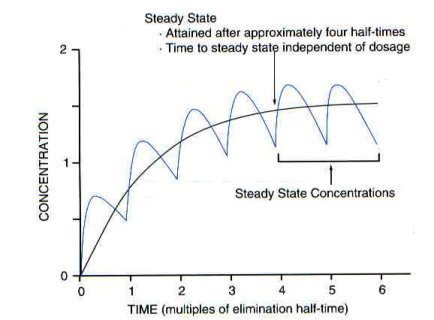
With first order elimination, at a certain point in therapy, the amount of drug administered during a dosing interval exactly replaces the amount of drug excreted. When this equilibrium occurs (rate in = rate out), steady-state is reached.
---------------------------------------------------------------------------------------------
Clearance (CL)Clearance is a descriptive term used to evaluate efficiency of drug removal from the body. Clearance is not an indicator of how much drug is being removed; it only represents the theoretical volume of blood which is totally cleared of drug per unit time. Because clearance is a first-order process, the amount of drug removed depends on the concentration.
Clearance can be thought of as the proportionality constant that makes the average steady-state drug level equal to the rate of drug administration. Clearance (rate out) can be calculated from the dose (rate in) and average steady-state concentration:
Cl = (Dose / interval) / Cpss ave
Elimination rate constant (Kel)With first-order elimination, the rate of elimination is directly proportional to the serum drug concentration (SDC). There is a linear relationship between rate of elimination and SDC. Although the amount of drug eliminated in a first-order process changes with concentration, the fraction of a drug eliminated remains constant. The elimination rate constant (Kel) represents the fraction of drug eliminated per unit of time.
Here is an example of a first order process:
Time
(hrs) Amount remaining
in body Amount
eliminated Fraction
eliminated
0 1000 - -
1 850 150 0.15
2 723 127 0.15
3 614 109 0.15
4 522 92 0.15
5 444 78 0.15
The serum level curve observed from a drug eliminated by a first order process:

A plot of this same data using a log scale on the y-axis results in a straight line

The slope of this straight line correlates to Kel.
Mathematically, this relationship may be represented by the following equation. If we plug in post-distribution serum levels (i.e., peak and trough levels), and the time difference between them, we can calculate a Kel which is specific for this patient:
Kel = ln(Peak / Trough) / time
Once we have the Kel, we can rearrange this equation to predict the time it takes to reach a specific serum level. If we plug our target peak and trough levels in, then we can use this equation to calculate an ideal dosing interval (tau):
tau = ln(Peak / Trough) / Kel
---------------------------------------------------------------------------------------------
Half-life (t ½)Another important parameter that relates to the rate of drug elimination is half-life (t ½). The half-life is the time necessary for the concentration of drug in the plasma to decrease by half. Both t ½ and Kel attempt to express the same idea, how quickly a drug is removed, and therefore, how often a dose has to be administered. An important relationship between t ½ and Kel can be shown by mathematical manipulation:
T ½ = 0.693 / Kel
Relationship between Kel, Vd, and CL
Kel (and t ½) are dependent upon clearance and the volume of distribution. However, it is invalid to make any assumptions about the Vd or CL of a drug based solely upon knowledge of its half-life.
Kel = CL / Vd
Summary
Most drugs are eliminated by a first-order process.
Steady-state is that equilibrium point where the amount of drug administered exactly replaces the amount of drug excreted.
Clearance represents the theoretical volume of blood which is totally cleared of drug per unit time.
Kel represents the fraction of drug eliminated per unit of time.
The slope of a log-scale serum level decay curve correlates to Kel.
t ½ is the time necessary for the concentration of drug in the plasma to decrease by half.
-------------------------------------------------------------------------------------------------
Pharmacokinetic modelingPharmacokinetic models are relatively simple mathematical schemes that represent complex physiologic spaces or processes. Accurate PK modeling is important for precise determination of elimination rate.
The most commonly used pharmacokinetic models are:
1-compartment
2-compartment
One compartment modelAll drugs initially distribute into a central compartment (Vc) before distributing into the peripheral compartment (Vt). If a drug rapidly equilibrates with the tissue compartment, then, for practical purposes, we can use the much simpler one-compartment model which uses only one volume term, the apparent volume of distribution, Vd.

Example
The distribution phase for aminoglycosides is only 15-30 minutes, therefore, we can use a one-compartment model with a high degree of accuracy.
Serum level plot for a 1-compartment model
Yields a straight line when using a log scale on the y-axis.
 Two compartment model
Drugs which exhibit a slow equilibration with peripheral tissues, are best described with a two compartment model.

Example
Vancomycin is the classic example, it's distribution phase is 1 to 2 hours. Therefore, the serum level time curve of vancomycin may be more accurately represented by a 2-compartment model.
Serum level plot for a 2-compartment model
Yields a biphasic line when using a log scale on the y-axis.

Distribution phase
During the initial, rapidly declining distribution phase, drug is moving from the central compartment to the tissue compartment.
Elimination phase
Elimination of drug is the predominant process during the second phase of the biphasic plot. Because elimination is a first-order process, the log plot of this phase is a straight line.
Note: You should also note from this graph that failure to consider the distribution phase can lead to significant errors in estimates of elimination rate and in prediction of the appropriate dosage. This is especially important with vancomycin. Unless you are using a two-compartment model, you should not use a level drawn during the distribution phase to calculate the elimination rate.
Summary
A one-compartment model may be used for drugs which rapidly equilibrate with the tissue compartment, e.g, aminoglycosides.
A two-compartment model should be used for drugs which slowly equilibrate with the tissue compartment, e.g, vancomycin.
A log scale plot of the serum level decay curve of a 1-compartment model yields a straight line.
A log scale plot of the serum level decay curve of a 2-compartment model yields a biphasic line.
Failure to consider the distribution phase can lead to significant errors in estimates of elimination rate.
-----------------------------------------------------------------------------------
Therapeutic drug monitoring
The basic goal of therapeutic drug monitoring (TDM) is to enhance the patient's chance of maximum benefit from a prescribed drug while minimizing the risks of toxicity. Characteristics of drugs associated with TDM are:
Narrow therapeutic range.
Unpredictable dose/response relationship.
Significant consequences from toxicity.
Correlation between SDCs and efficacy or toxicity.
Readily available assays.
-------------------------------------------------------------------------------------------
Steady stateAs successive doses are administered, drug begins to accumulate in the body. With first order elimination, at a certain point in therapy, the amount of drug administered during a dosing interval exactly replaces the amount of drug excreted (rate in = rate out). When this equilibrium occurs, the peak and trough drug concentrations are the same for each additional dose given. When peak and trough concentrations are the same with two or more successive doses, steady-state is reached.
The time required to reach steady-state is approximately 4 to 5 half-lives.

Note:You should note from this graph that failure to evaluate steady-state levels can lead to significant errors in estimates of elimination rate and in prediction of the appropriate dosage. Therefore, serum sampling is best performed at steady-state.
Timing serum level draws
Serum samples must be drawn during the elimination phase, when net distribution is complete.

Note: You should note from this graph that failure to consider the distribution phase can lead to significant errors in estimates of elimination rate. An accurate measure of Kel can only be obtained when serum levels are drawn in the elimination phase.


